Application Description
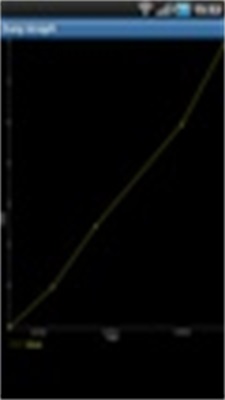
Tired of wrestling with quantifiable data? Easy Graph is your solution. This intuitive application simplifies the tracking and management of metrics, from electricity consumption to any other quantifiable data. Its user-friendly interface allows for easy daily data entry, transforming your numbers into insightful value graphs and growth charts. Need deeper analysis? Export your data as a text file for further processing on your computer.
Easy Graph Key Features:
-
Streamlined Data Management: Effortlessly track and manage numerous data sets with a focus on simplicity and ease of use. Perfect for monitoring various metrics.
-
Simplified Input: Enjoy a straightforward interface for convenient daily data entry. Manage multiple date/value lists without difficulty.
-
Visual Data Insights: Gain clear understanding with visually appealing value graphs and growth line charts. Quickly identify trends and progress.
-
Data Export: Export your datasets to a text file for in-depth analysis using desktop software. Enhance your reporting capabilities.
-
Intuitive Design: A user-friendly graphical display ensures efficient data monitoring and reporting. Accessible for users of all technical levels.
-
Permissions: The app requires internet access (primarily for ads) and external storage access (for data export). These permissions are essential for full functionality.
In Conclusion:
Easy Graph provides a seamless experience for anyone needing to monitor and visualize their data. Its ease of use, coupled with clear visual representations, makes tracking progress and identifying trends simple and efficient. Download Easy Graph today for hassle-free data management.
Screenshot


Reviews
Post Comments
Latest Articles
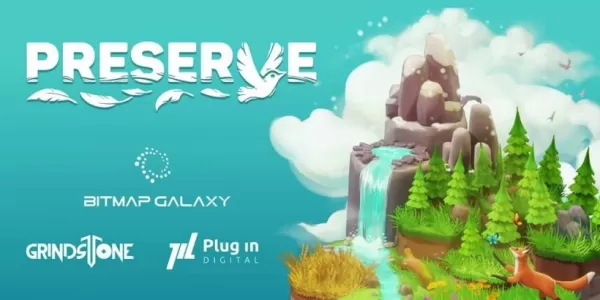
Preserve is an environmentalist puzzler that challenges you to restore the environment
Preserve blends gameplay elements from Dorfromantik and Quilts & Cats of Calico, bringing them seamlessly to mobile devices.Immerse yourself in world restoration by strategically placing animals and natural landscapes.Unlock classic, creative, and pu

Where\'s Potato? lets you play as an elusive potato with a penchant for hiding or a Seeker trying to put a potato in its place, out now
- Play as a potato and try to hide from your friends- Play as a Seeker to find the potato before time runs out- Now available on iOS and AndroidIndie developer Nav has announced that Where's Potato?, the studio's potato-themed prop hunt game, is now

Netflix will soon offer interactive party games you and your friends can play via mobile
Netflix is set to introduce party gamesPictionary, Boggle and other big names will join the lineupIt's set to be rolled out over the coming monthsNetflix’s big push into gaming has had mixed results over the years. While their ambitions to have a rea
Alien: Earth Episode 6 Review
I don’t believe it’s an accident that Noah Hawley titled Episode 6 of Alien: Earth “The Fly.” The series returns to the present tense to delve deeper into the nature of humanity through the experiments on Neverland. The episode’s title, drawn from on
Minion Rush Adds Endless Runner Mode in Major Update
Gameloft has launched a major update for Minion Rush: Running Game, introducing significant improvements both behind the scenes and in gameplay. The game now runs on a new engine, includes fresh features, and offers updated ways to play.What Changes
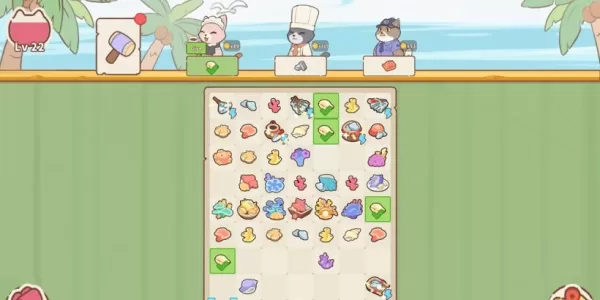
Mobirix Launches Cute Cat Merge Game: Merge Cat Town
- Merge Cat Town: Mobirix's charming new puzzle game brings feline fun- Combine items to restore and upgrade your cuddly cats' island paradise- Expand your village by welcoming new feline friends and structuresThe match-merge genre has seen countless
Apps like Easy Graph


Cuma Mesajları
Personalization丨38.50M


Cincinnati Bengals
Personalization丨197.00M


Latest Apps

Barbearia Don Restani
Beauty丨30.8 MB

Espaço A+ Mario Ferraz
Beauty丨25.0 MB

Iria Oliveira
Beauty丨2.0 MB

Fio a Fio Cabelo e Art
Beauty丨36.6 MB


Beauty Bar Recife
Beauty丨11.4 MB

Em Poa Barber
Beauty丨23.0 MB

Barbearia Harley Pub
Beauty丨62.3 MB

Barbearia Tribos
Beauty丨18.7 MB
Trending Apps
MORE +


Top News
MORE +

01
01-16
Zenless Zone Zero Confirms Version 1.5 Special Program Livestream Date and Time
SummaryZenless Zone Zero revealed the start date for Version 1.5 "Astra-nomical Moment" on January 10 at 19:30 (UTC+8).Version 1.5 plans to add S-Rank characters Astra Yao and Evelyn Chevalier.Not much else is known about Version 1.5, though recent leaks have teased plenty of new content and events
02
01-21
Final Fantasy Updates Fix Controller Glitch
Patches for Final Fantasy VII Remake are now available on Steam, the Epic Games Store, and PlayStation 5. This update resolves issues with controller vibration motors. The game follows Cloud Strife, a former SOLDIER, as he joins Avalanche to prevent Shinra Electric Power Company from destroying th
03
04-18
"Jurassic World Rebirth Trailer Unveils Dinosaur Chaos Before Summer Release"
Jurassic World Rebirth made a roaring entrance during Super Bowl Sunday with a special trailer that showcased even more dinosaur action in anticipation of its July 2025 premiere. The latest footage features stars Scarlett Johansson and Mahershala Ali, who initially capture the audience's attention b
04
12-12
Immersive Adventure Awaits in 'In the Turquoise Moonglow' Update for Wuthering Waves
Wuthering Waves Version 1.2 Update: A Sneak Peek at "In the Turquoise Moonglow"
Get ready, Wuthering Waves players! Kuro Games is launching Phase One of the highly anticipated Version 1.2 update on August 15th. A new trailer reveals exciting additions, including a fresh Resonator, new weapons, ques
05
04-24
"Dune: Awakening Delay Extended by Three Weeks for Beta-Inspired Changes"
Dune: Awakening, the highly anticipated open-world survival MMO inspired by Frank Herbert's iconic sci-fi novels and Denis Villeneuve's films, has been pushed back to a new release date of June 10, 2025. Funcom, the game's developer, announced this delay alongside an exciting early access opportunit
Topics
More +